






About ValheimPerformanceAnalyzer
From ThunderstoreProfiles Valheim/mod callbacks, frame percentiles and slow frames, profiler overhead, loaded objects, process/GPU metrics, and network/RPC diagnostics. Includes a HUD, HTML reports, and optional admin-only server telemetry.
Valheim Performance Analyzer
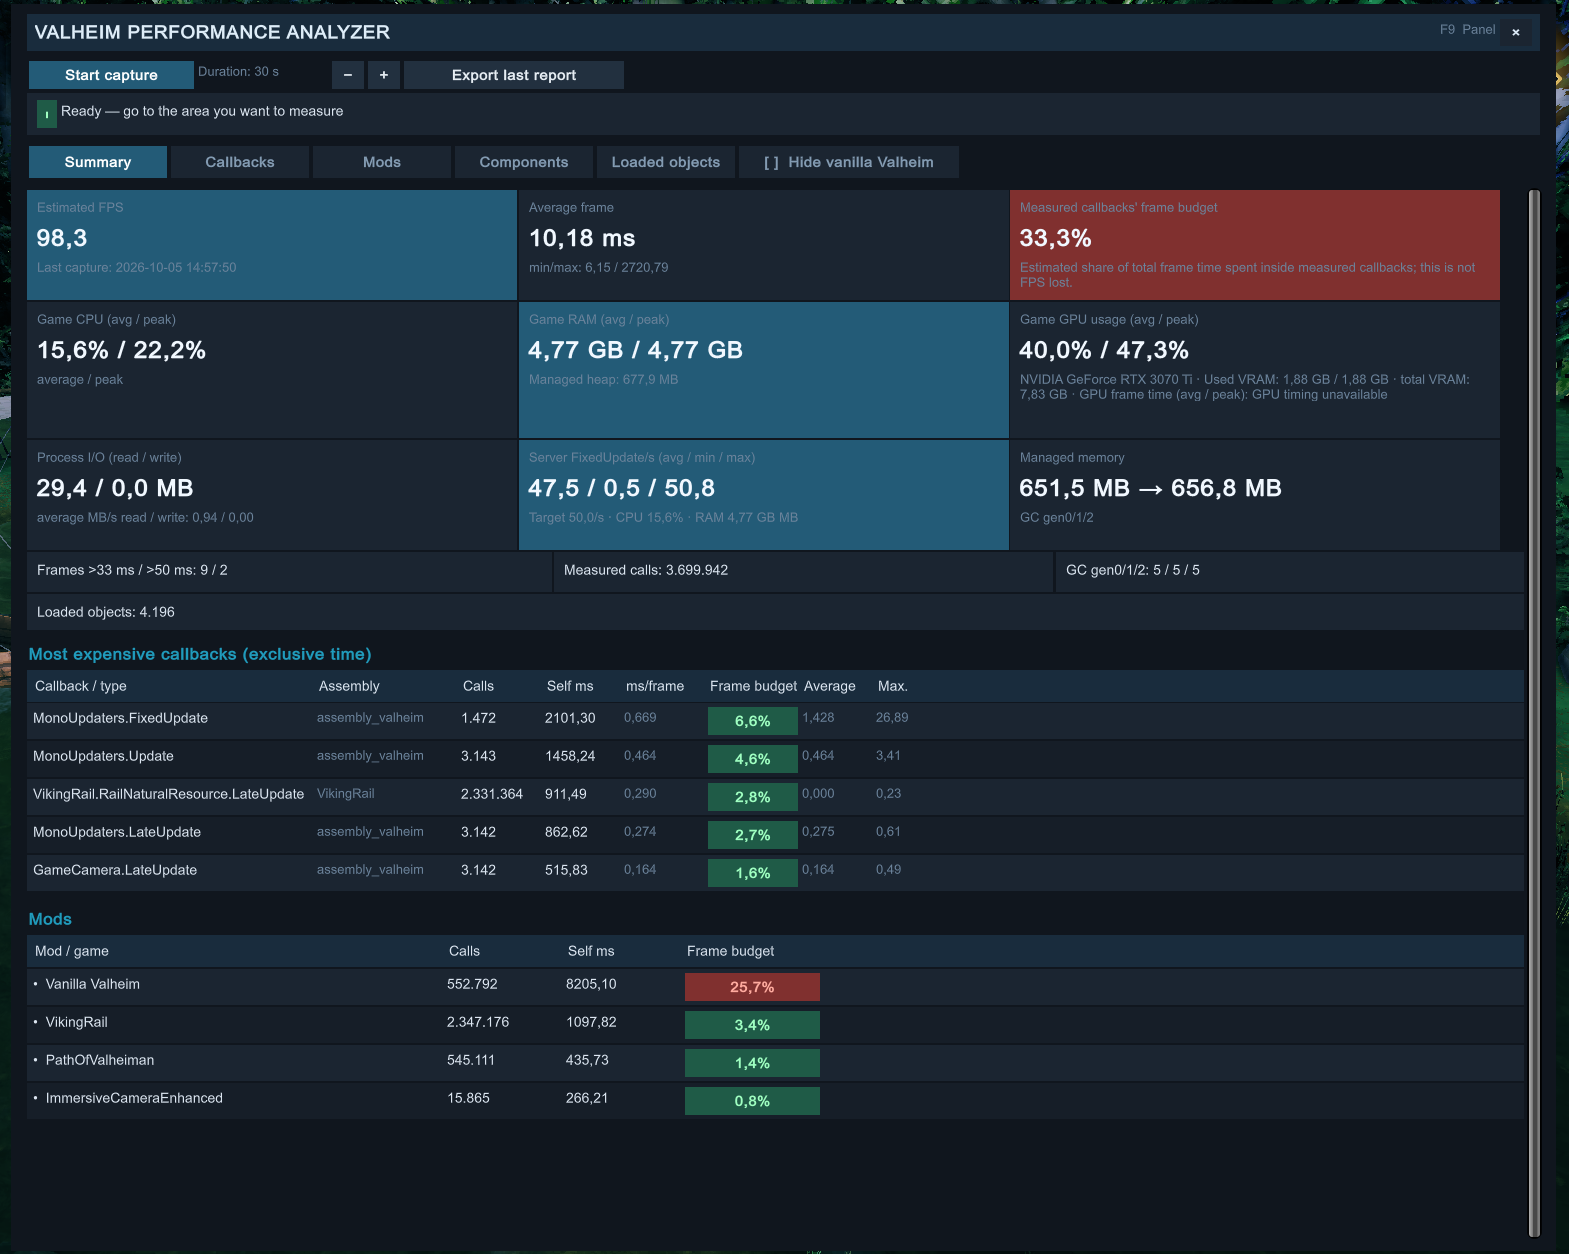
A BepInEx tool for finding which Valheim and mod callbacks consume the most time during gameplay. Includes frame percentiles, a slow-frame timeline, measured Analyzer work, optional simulation detail, compatibility coverage, and network/RPC diagnostics. Version 1.1.3 adds responsive HUD tables and a capture status countdown synchronized to real elapsed capture time.
Features
- Measures exclusive time, call count, average and maximum duration, and exceptions for instrumented recurring callbacks.
- Starts the measurement clock after capture preparation and patch installation. Preparation and patching times are reported separately from the recorded gameplay window.
- Records estimated FPS, frame time, P50/P95/P99 frame-time percentiles, slow frames, and the estimated frame-time share of measured callbacks. Retains up to 256 of the slowest frames in a chronological timeline with the largest observed callback, GC counts, and measured Analyzer work in the same interval.
- Resizes HUD tables for slow frames, RPC methods, callbacks, mods, components, instances, and loaded objects with the panel. Column minimums account for localized headers; spare width is distributed across the table, with horizontal scrolling when needed. Cells stay on one line and retain their full text in tooltips.
- Displays the HUD slow-frame timeline in a nine-column table with eight rows per page. Right-aligned numeric columns separate the frame index, elapsed capture time, frame duration, largest observed callback and its inclusive duration, per-generation GC count changes, and measured collector/object-scan/snapshot times. Callback names use tooltips when truncated, and narrow HUD windows can scroll the table horizontally. Page controls provide access to all retained rows in chronological order.
- Reports measured collector, object-scan, and display-snapshot work. During a capture, periodic display snapshots are built only while the HUD is open. Component, loaded-object, and RPC detail is copied only for its corresponding tab. Live Summary percentiles refresh at most every five seconds; final percentiles use exact nearest-rank values over the retained intervals.
- Optionally instruments selected AI, movement, pathfinding, and
MonoUpdaterssimulation routines. Detailed simulation is off by default because additional timing hooks increase profiling cost. - Lists foreign Harmony patch owners as callback metadata. Protected callbacks already patched by Balrond Core Optimizer are excluded to preserve its optimizations;
LineConnect.LateUpdateis also protected when that plugin is loaded. Coverage lists the exclusions and compatibility warnings. - Measures Valheim process CPU use as a percentage of total logical processor capacity and process resident memory (working set), including average and peak values. On Windows, process memory also uses the native process memory API as a fallback.
- Reports managed heap size, managed memory change, and garbage collection counts. Heap measurements are sampled separately from the process working set.
- On Windows, measures the game's process-attributed 3D engine utilization and dedicated graphics memory when the system GPU counters are available. GPU utilization is an approximate per-process sample, not a vendor sensor reading.
- Reports GPU frame time from Unity when supported by the graphics backend and driver, along with the graphics device and detected total VRAM.
- Optionally counts loaded world entities with
ZNetView, including hidden, inactive, and off-camera trees, items, and buildings. Players and creatures are excluded. The Loaded objects tab consolidates entities by object name and owning mod/game, sorted by quantity, with a total entity count. Expand a row to inspect its Unity instance IDs. Enable Capture loaded objects in the HUD to collect complete scans during a capture, with a two-second interval after each completed scan. Classification runs in batches across frames. Unity's initial object discovery remains synchronous and its cost is measured. Opening the HUD alone never scans. - Records process read and write bytes and average I/O rates. Windows counters may include cached operations and do not represent physical disk traffic.
- Measures the observed
FixedUpdaterate and compares it with Unity's target rate. On dedicated servers, this represents the simulation ticks observed by the mod. - Sends lightweight server
FixedUpdate, CPU, and RAM metrics to clients every two seconds. The server sends these metrics only to clients that have this mod installed and whose accounts are recognized as server admins. To view dedicated server metrics, install the mod on both the server and client and connect as an admin. Remote metrics are unavailable without the server mod or admin access. - Adds a Network tab with application socket bytes/messages and rates, anonymous peer summaries, transport send-backlog estimates, supported Steam transport RTT/quality, passive application RTT, jitter, and inclusive RPC costs grouped by method hash. Passive RTT observes the game's native ping/pong without extra traffic and can work with Steam or PlayFab, including unmodded servers. A separate active Analyzer diagnostic adds application round-trip time and server-handler work for authorized admins.
- Groups callbacks by mod assembly and combines
assembly_valheimwithassembly_utilsunder vanilla Valheim. The frame budget percentage estimates each group's share of observed frame time. - Lets you expand each group to inspect its measured callbacks. The Hide vanilla Valheim filter is off by default and also filters the loaded-object list when an object's source can be identified.
Highlights
From source dataLoaders
Runs on BepInEx.
Footprint
Rated a light load on a server.
Last update
Its author last shipped an update 17d ago.
ValheimPerformanceAnalyzer on Nxeon
From our catalogue- One-click install
- Supported on Nxeon Valheim servers, for BepInEx servers. We download it from Thunderstore, place it, and restart the server.
- Server side
- Optional on the server
- Server type needed
- BepInEx
- Server load
- light
- Smallest plan we suggest
- Valheim — 4 GB (4 GB RAM). This follows our own load rating above, not a benchmark.
- Latest build
- 1.1.3, released 2026-10-18
Game versions by loader
| Loader | Game versions | Newest |
|---|---|---|
| BepInEx |
From 4 recorded builds of ValheimPerformanceAnalyzer.
Recent builds
| Build | Released | Game versions | Loaders |
|---|---|---|---|
| 1.1.3 | 2026-10-18 | n/a | BepInEx |
| 1.1.2 | 2026-10-18 | n/a | BepInEx |
| 1.0.1 | 2026-10-05 | n/a | BepInEx |
| 1.0.0 | 2026-10-05 | n/a | BepInEx |
Dependencies
- Required: BepInExPack Valheim
Declared by the newest build that lists any. Required ones are installed with it on one-click installs.
Run ValheimPerformanceAnalyzer on a Valheim server
Pick a server or deploy a new one above; it is installed in one click.
What kind of mod it is
From the catalogQuality of life & UI
Small conveniences, tweaks and interface improvements players notice straight away.
Works on a server
From source side supportThunderstore lists server-side support for ValheimPerformanceAnalyzer as optional: it can run on a server, but isn’t required there.
Compatibility
- Game
- Valheim
- Loaders
- BepInEx
- Runs on
- Serveroptional on the server
- Requires
- One-click install needs a BepInEx server.
Verified at the source
- ✓ThunderstoreOfficial listing, checked 2026-10-18Open ↗
- ✓AuthorXineladaLendaria, as published on Thunderstore
- ✓LicenseNot published by the sourceFree