You can't fix what you can't see. Learn the essential Linux monitoring tools — from quick htop checks to a full netdata dashboard with alerts.
A server that's silently struggling will eventually fall over at the worst moment. Monitoring turns invisible problems into visible ones — a CPU pegged at 100%, a disk filling up, memory being swapped to death. This guide covers the tools, from a quick terminal glance to a full always-on dashboard.
The quick glance: htop
htop is an interactive process viewer — the first thing to open when something feels slow. Install it:
sudo apt install htop -y
htop
You get live CPU cores, memory, swap, and a sortable process list. Press F6 to sort by memory or CPU, F9 to kill a runaway process. It's the fastest way to answer "what's eating my server right now?"
Memory and swap: free
free -hIf available is near zero and swap is filling, you're memory-constrained — consider a swap file as a stopgap or more RAM as a fix.
Disk usage: df and du
A full disk breaks almost everything. Check filesystem usage and find the culprits:
df -h
du -sh /var/* | sort -rh | head
See check and free up disk space for the full workflow.
I/O and load: iostat and uptime
uptime          # load averages: 1, 5, 15 min
sudo apt install sysstat -y
iostat -x 2     # per-disk utilisation, updated every 2s
A load average consistently above your core count means work is queuing up.
Network: ss and iftop
See listening ports and active connections:
sudo ss -tulnpFor live bandwidth per connection:
sudo apt install iftop -y
sudo iftop
The full dashboard: netdata
For continuous, visual, always-on monitoring, netdata is superb — thousands of metrics per second with a web dashboard and near-zero configuration:
wget -O /tmp/netdata-kickstart.sh https://get.netdata.cloud/kickstart.sh
sh /tmp/netdata-kickstart.sh
By default it serves on port 19999. Do not expose that to the internet — bind it to localhost and reach it over an SSH tunnel, or restrict the port with your firewall.
Add alerts so you don't have to watch
Monitoring only helps if it tells you before users do. netdata can email or push alerts on thresholds (disk >90%, high load, service down). For service-level checks, pair it with health checks and auto-restart so failing services recover on their own.
Read the logs too
Metrics tell you *that* something's wrong; logs tell you *why*. Get comfortable with journalctl to correlate a metric spike with what the application was doing.
A lightweight, script-friendly snapshot
Sometimes you don't want a dashboard — you want a one-line answer you can log or alert on. vmstat and a couple of pipes give you a quick machine-readable snapshot:
# CPU idle %, free memory MB, load average
echo "load: $(cut -d' ' -f1 /proc/loadavg)  mem_free: $(free -m | awk '/Mem:/{print $7}')MB"
This is handy inside a cron job or a health check that pings you when something crosses a threshold. glances is another excellent all-in-one tool worth installing — it shows CPU, memory, disk, network, and processes in a single screen and can export metrics or run as a lightweight web server:
sudo apt install glances -y
glances
What "normal" looks like
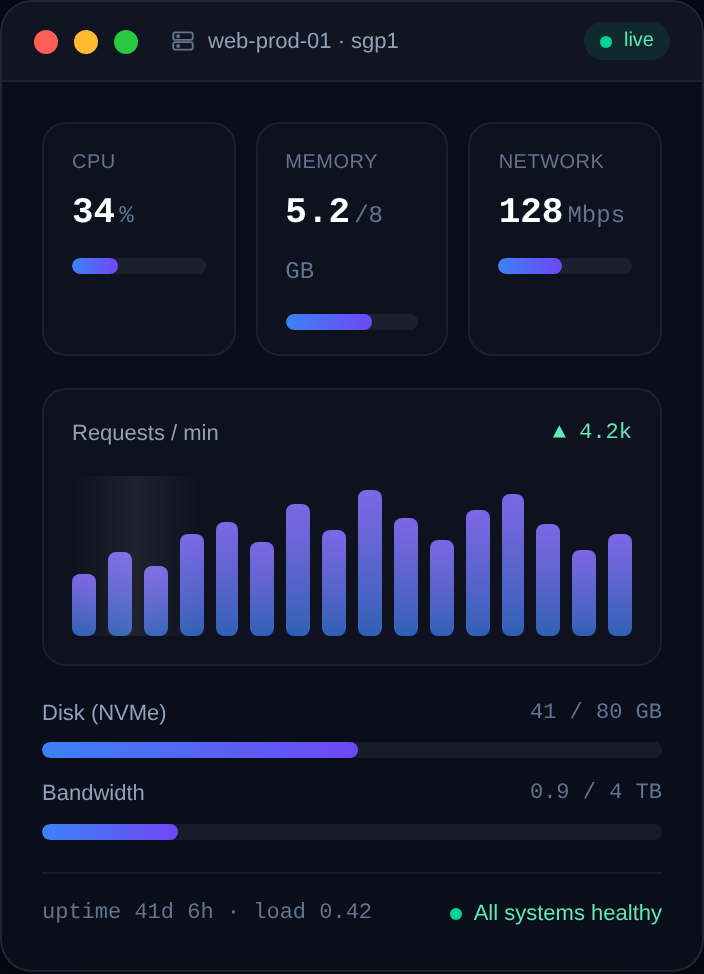
Numbers only mean something against a baseline. Spend a little time observing your server under typical load so you know its normal ranges: a web app might idle at 5% CPU and 40% memory, spiking to 60% CPU during traffic peaks. Once you know normal, abnormal jumps out — a process stuck at 100% CPU, memory creeping upward for hours (a leak), or disk I/O saturated during what should be a quiet period. The single most common surprise on a small VPS is memory: watch that free memory doesn't trend toward zero with swap filling, which signals you're outgrowing the plan. Capture these baselines when things are healthy, not during an incident, so you have something to compare against when you actually need it. Good monitoring isn't about staring at graphs — it's about knowing your normal well enough that alerts, not luck, tell you when it changes.
FAQ
htop vs top — which should I use?
htop is a friendlier, colour-coded, interactive version of top with mouse support and easy sorting/killing. Use htop; top is the always-installed fallback.
Is netdata safe to run?
Yes, but never expose its dashboard publicly — bind it to localhost and use an SSH tunnel, or firewall port 19999. Its own agent is lightweight.
What metrics matter most on a small VPS?
Memory/swap pressure, disk space, and load average catch the majority of problems. Watch those first, then network and I/O.
How do I get alerted when a service crashes?
Use systemd's restart policies or a dedicated health-check setup. Combine metric alerts (netdata) with service watchdogs for full coverage.
Your monitoring toolkit at a glance
Match the tool to the question you're asking:
- "What's slow right now?" —
htopfor live processes, CPU, and memory. - "Am I low on memory?" —
free -h; watchavailableand swap usage. - "Is the disk filling?" —
df -hfor usage,du -sh /var/*to find hogs. - "Is the disk or CPU the bottleneck?" —
iostat -x 2anduptimeload averages. - "What's on the network?" —
sudo ss -tulnpfor ports,iftopfor live bandwidth. - "What happened over time?" — netdata or glances for continuous, visual history.
- "Why did it happen?" —
journalctlto correlate a spike with application logs.
The two habits that make all of this pay off: know your server's normal ranges so anomalies stand out, and set alerts so problems reach you before your users do. Monitoring isn't about watching graphs all day — it's about being told, early and automatically, when something drifts away from the baseline you've established while things were healthy.
Good monitoring is the difference between fixing a problem at 2pm and discovering it at 2am. Run it on a VPS with the headroom to grow — see Nxeon VPS plans and the VPS overview.
Cloud VPS hosting
Deploy in seconds, not weekends
Nxeon · Nxeon editorial
★★★★★ Straight-talking guides from the team that runs the servers.