




About Power Graphs
From Steam WorkshopThis programmable block script tracks power and gas statistics over time and displays them as graphs on any block display. It comes with a variety of graph types including: overall grid power usage,…
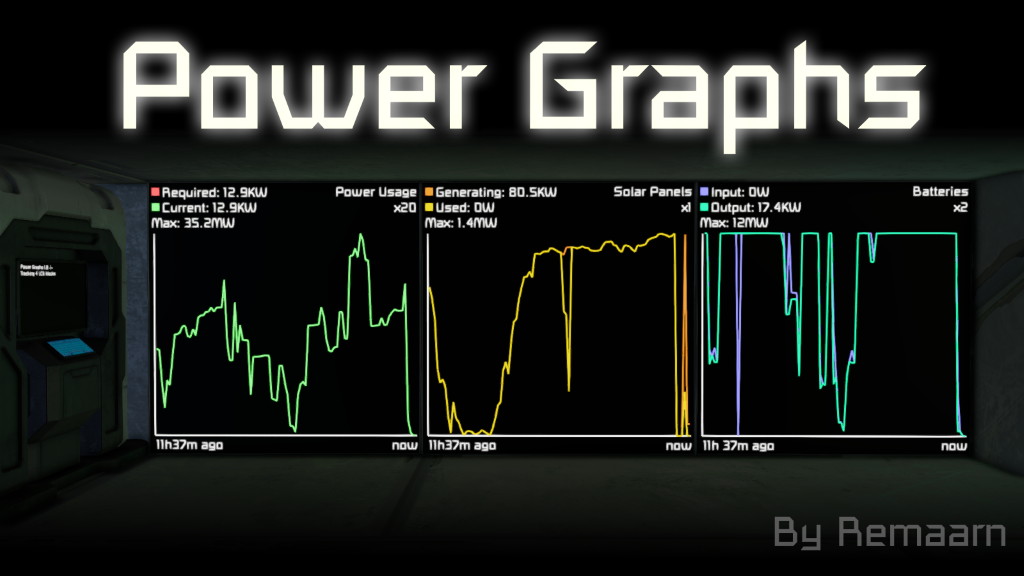
This programmable block script tracks power and gas statistics over time and displays them as graphs on any block display. It comes with a variety of graph types including: overall grid power usage, battery charge levels, solar panel / wind turbine output and more.
This script is not currently under active development. New features are unlikely to be added however it will still be updated with fixes if any Space Engineers update happens to break it.

Graph types that can be displayed, not case sensitive:
usage - Total power usage / required power usageScaled - Same as usage but scaled to the total max required power battery - Battery charge batteryIn - Battery input batteryOut - Battery output batteryInOut - Combined battery input and output batteryInOutAuto - Same as batteryInOut but scaled by peak value. solar - Solar power output / used solar power reactor - Reactor power output h2engine - Hydrogen engine power output wind - Wind turbine power output storedOxygen - Stored Oxygen* storedHydrogen - Stored Hydrogen*
* Must be enabled in the configuration (which is in the Custom Data of the program block).
Setup
- First make sure that Ingame Scripts are enabled for your world. This will require Experimental Mode to be turned on in the game settings. - Once in a world, add the script to a programmable block on the grid you want to monitor. - Add the name tag (default is [PowerGraph]) into the names of any display blocks you want to show graphs on. - The displays should automatically start cycling between graphs. - To show only specific graph types on a display, write the names of the graph types (shown above) that you want into the CustomData of the display block, one type per line.
Configuration
There are additional usage instructions at the beginning of the script text inside the PB. These include how to show graphs on specific screens in multi-screen blocks.
Important! After the program first runs it generates configuration text inside the Custom Data of the programmable block. There are many important configuration options there along with their descriptions. Please read through them as they may be very important for your use case. The script must be recompiled to apply configuration changes.
To reset the saved data of a program block run the script with the argument "resetData" without the quotes.
Timing
By default the script collects data after every update interval (default 60 seconds) up to 100 data points (200 if using long history). At default settings this will give about 1.6 hours of data. Reducing the update interval (the Data_Update_Interval_In_Seconds setting in the script) will reduce the span of time that a graph covers. For performance reasons values under 10 seconds are not recommended. Using default resolution settings the amount of time covered by a graph on a standard LCD can be calculated as (100 * update interval seconds). Eg: when using an interval of 30 seconds the graph will span 50 minutes.
Sensor LCD Culling
This feature allows the script to only update LCDs when a player is in range of a sensor. It is useful for servers and worlds where players are often not near LCDs since the script then doesn't need to update the displays. Using sensor LCD culling is recommended for maintaining performace when many script instances are being used.
Help
I installed the script but my screens show nothing!
If you want to display graphs on LCDs that are on connected grids you will need to enable support for this in the script configuration. Look for the option called Display_On_LCDs_Of_Attached_Grids.
I have solar panels/gas tanks but the graph says there are none!
If your solar panels/gas tanks are on a sub-grid (ie. connected via rotors, etc) you will need to enable the option for reading the power of connected grids in the script configuration (which is in the program block Custom Data, not the script code). Look for the lines that start with Include_Data_From_Attached_(Small/Large)_Grids. There are different options for small and large grids. If you also want to read power of grids attached via connectors there are additional options for doing so.
I made changes to the configuration but it doesn't seem to work!
Starting with Power Graphs version 1.8.6 all configuration options have moved to the Custom Data section of the program block. Trying to change the settings inside the script code will not work. Once you have edited the config in Custom Data you will need to recompile the script for the changes to take effect.
Notes / Known Issues
- Pausing the game may record power values of zero unless Zero_Fill_Missing_Values is set to false. - Enabling long history will use more performance and if using on a server more network bandwidth.
If you still want to use the old bitmap version of the script you can find it here: https://steamcommunity.com/sharedfiles/filedetails/?id=1710076979
Highlights
From source dataFootprint
A 485 KB download, rated a light load on a server.
Last update
Its author last shipped an update 4 yr ago.
Power Graphs on Nxeon
From our catalogue- One-click install
- Not available. One-click install isn't available for this game's mods yet. Download it and upload it to your server in Files.
- Server load
- light
- Smallest plan we suggest
- Space Engineers — 8 GB (8 GB RAM). This follows our own load rating above, not a benchmark.
- Latest build
- 2023-01-29, released 2023-01-29, 485 KB
Game versions by loader
| Loader | Game versions | Newest |
|---|---|---|
| Workshop |
From 1 recorded build of Power Graphs.
Run Power Graphs on a Space Engineers server
Deploy a server above, then upload the file in Files.
What kind of mod it is
From the catalogQuality of life & UI
Small conveniences, tweaks and interface improvements players notice straight away.
Compatibility
- Game
- Space Engineers
- File size
- 485 KB
Verified at the source
- ✓Steam WorkshopOfficial listing, checked 2026-10-10Open ↗
- ✓AuthorRemaarn, as published on Steam Workshop
- ✓LicenseNot published by the sourceFree